Showing posts with label physics. Show all posts

Monday, 8 June 2020

ARTICLE: Transport planning in biology

Efficient vasculature investment in tissues can be determined without global information
S Duran-Nebreda, IG Johnston, GW Bassel
Journal of the Royal Society Interface 17 20200137 (2020)


We need roads. Roads link up different parts of our society, allowing us to send messages and supplies from one region to another. But they come at a cost. If we lay down a road across the country, we can't use that land to farm or build houses, and maintaining roads costs a lot of tax money.

Multicellular organisms have the same issue. They also need to send supplies (e.g. nutrients) and messages (e.g. chemical signals) from one place to another. So they build roads. Our blood vessels are one example, transporting oxygen and hormonal messages throughout our bodies. So-called vasculature -- our blood vessels are one example, as are xylem and phloem in plants -- is used to allow transport around an organism. But again, if some parts of the organism are being used for transport, they can't be used for doing other useful things.

Given this cost of producing "roads", organisms would presumably like to be efficient as possible when laying out their transport systems. This may involve, for example, making journey lengths as short as possible while using as little land as possible for roads. But while city planners and engineers can look at maps and run simulations to work out how best to place roads, organisms lack a top-down "planner" with a large-scale map. How then do organisms efficiently resolve this tradeoff? Specifically, how is it decided where best to place vasculature to minimise the effective distance between cells?

We took a look at this using a theoretical model where an organism's tissue is modelled as a collection of cells in a 2D layer, a 3D block, or an intermediate case involving a set of layers, or a more realistic structure taken from experimental characterisation of plant tissues. We considered different ways that an organism might produce vasculature by fusing together cells in this model tissue to make "roads". This method for making vasculature models the case in immobilised cells, like we find in plants. We considered different ways that cells might be chosen to fuse, based on the physical structure of the tissue, and allowing some randomness in this decision.


 How has this plant made efficient "roads" (vasculature, like the veins seen here) without having a map of the whole leaf? We found that it can do a pretty good job without a global map, just using local sensing.

We found that using a "top-down" planner (with a map of all cells – which organisms don't have!) to choose which cells to fuse is usually the best way of producing an efficient transport network. But, we found that "bottom-up" approaches, where cells fuse based on purely local information (as opposed to a global map of the whole tissue) can actually do almost as well as the top-down planner. Strikingly, we found that these bottom-up approaches can provide "scale-free" improvements in transport. This means that the amount by which having more roads decreases journey lengths doesn't depend on the overall size of the system. The transport improvements from vasculature were more pronounced in 3D than in 2D, and the best approach for vasculature production varied in the different plant tissues we looked at. This suggests that there may be some evolutionary back-and-forth between the rules that plants use to create vasculature and the form of their tissues, which we plan to explore further in future!

Thursday, 9 January 2020

ARTICLE: Powering cellular decision-making

Intracellular energy Variability Modulates cellular Decision-Making capacity
Ryan Kerr, Sara Jabbari, Iain G Johnston
Scientific Reports 9 1 (2019)

The ability to process information and make decisions is fundamental to life. Intelligent organisms use their brains to do this, but individual cells are also constantly making decisions, changing their behaviour in response to microscopic stimuli. Examples of this cellular decision-making abound in biology: stem cells decide which type of cell to become; some bacteria decide to become robust "persister" cells that can survive drug treatments; cells in plant seeds decide when to germinate.

Often, the "decisions" that cells make involve which genes to express. Genes contain information on how to build cellular machinery, and "expressing" a gene in a sense means turning it on so that its machinery gets built in the cell. We often see that two genes, say A and B, build proteins that switch each other's genes off. So if we have lots of A, it's very hard to produce B, and vice versa. These genes can determine the type of cell we have -- for example, cells with lots of A might be white blood cells, and cells with lots of B might be red blood cells. A blood stem cell could then become a white or a red cell depending on how the interaction between A and B plays out.

All this is reasonably common knowledge (though rather simplified!). But we got interested in how energy plays a role in these decisions. Gene expression requires energy, which in the cell is provided by a molecule called ATP. Different cells have different amounts of ATP, so the processes involved in the interaction of our genes A and B can take place at different rates. Following some ideas we laid out here, we asked, using maths, how this energy dependence might affect the decisions that cells make.

We found, in a new paper free to read in Scientific Reports, that ATP levels strongly influence the decision-making capacity of a cell. Consider the simple A-B case above. Four states are possible: no A or B (state 0), more A than B (state A), more B than A (state B), and high A and B (state AB). We found that, at low ATP, only state 0 is possible (the cell can't make any decisions). As ATP increases, states A and B become possible, and for high ATP the state AB also appears. So, the number of states a cell can choose between (for example, white, red, or stem blood cell) depends strongly on how much energy that cell has available to power these genetic interactions.


We also found that more energy stabilised the decisions that could be made (cells are noisy, so decisions can be randomly "overturned" by gene expression fluctuations), and mapped out the "landscape" of decisions that can be made as the biochemical features of the genes involved change. We're now going to the lab to explore these mathematical predictions in real cells -- particularly in bacterial persister cells -- and developing the theory further for more complicated decision-making circuits.


Thursday, 11 July 2019

ARTICLE: Coupling mitochondrial physics and genetics

Mitochondrial Network State Scales mtDNA Genetic Dynamics
Juvid Aryaman, Charlotte Bowles, Nick S. Jones and Iain G. Johnston
Genetics Early online July 10, 2019; https://doi.org/10.1534/genetics.119.302423

Mitochondrial DNA (mtDNA) populations within our cells encode vital energetic machinery. MtDNA is housed within mitochondria, cellular compartments lined by two membranes, that lead a very dynamic life. Individual mitochondria can fuse when they meet, and fused mitochondria can fragment to become individual smaller mitochondria, all the while moving throughout the cell. The reasons for this dynamic activity remain unclear (we’ve compared hypotheses about them before here and here, with blog articles here). But what influence do these physical mitochondrial dynamics have on the genetic composition of mtDNA populations?

MtDNA populations can, naturally or as a result of gene therapies, consist of a mixture of different mtDNA types. Typically, different cells will have different proportions of, say, type A and type B. For example, one cell may be 20% type A, another cell may be 40% type A, and a third may be 70% type A. This variability matters because when a certain threshold (often around 60%) is crossed for some mtDNA types, we get devastating diseases.

We previously showed mathematically (blog) and experimentally (blog) that this cell-to-cell variability in mtDNA proportions (often called “heteroplasmy variance” and sometimes referred to via the “mtDNA bottleneck”) is expected to increase linearly over time. However, this analysis pictured mtDNAs as individual molecules, outside of their mitochondrial compartments. When mitochondria fuse to form larger compartments, their mtDNA is more protected: smaller mitochondria (and their internal mtDNA) are subject to greater degradation. More degradation means more replication, and more opportunities for the fraction of a particular type of mtDNA to change per unit time. In a new paper here in Genetics, we show (using a mathematical tour de force by Juvid) that this protection can dramatically influence cell-to-cell mtDNA variability. Specifically, the rate of heteroplasmy variance increase is scaled by the proportion of mitochondria that exist in a fragmented state. (It turns out that it's the proportion of itochondria that are fragmented that's important -- not whether the rate of fission-fusion is fast or slow).


This has knock-on effects for how the cell can best get rid of low-quality mutant mtDNA. In particular, if mitochondria are allowed to fuse based on their quality (“selective fusion”), we show that intermediate rates of fusion are best for removing mutants. Too much fusion, and all mtDNA is protected; too little, and good mtDNA cannot be sorted from bad mtDNA using the mitochondrial network. This mechanism could help explain why we see different levels of mitochondrial fusion in different conditions. More broadly, this link between mitochondrial physics and genetics (which we’ve also speculated about here (blog) and here) suggests one way that selective pressures and tradeoffs could influence mitochondrial dynamics, giving rise to the wide variety of behaviours that remain unexplained. Juvid, Nick, and Iain

Saturday, 10 June 2017

ARTICLE: Supply, demand, energy, and death

Mitochondrial heterogeneity, metabolic scaling and cell death
J Aryaman, H Hoitzing, JP Burgstaller, IG Johnston, NS Jones
BioEssays e201700001; doi:10.1002/bies.201700001 (2017)
  •  The links between mitochondrial functionality and various aspects of cell physiology remain unclear; we combine recent experimental insights with mathematical modelling to produce quantitative hypotheses linking metabolism, cell proliferation, and mitochondria.
Cells need energy to produce functional machinery, deal with challenges, and continue to grow and divide -- these activities and others are collectively referred to as "cell physiology". Mitochondria are the dominant energy sources in most of our cells, so we'd expect a strong link between how well mitochondria perform and cell physiology. Indeed, when mitochondrial energy production is compromised, deadly diseases can result -- as we've written about before.

The details of this link -- how cells with different mitochondrial populations may differ physiologically -- is not well understood. A recent article shed new light on this link by looking at a measure of mitochondrial functionality in cells of different sizes. They found what we'll call the "mitopeak" -- mitochondrial functionality peaks at intermediate cell sizes, with larger and smaller cells having less functional mitochondria. The subsequent interpretation was that there is an “optimal”, intermediate, size for cells. Above this size, it was suggested that a proposed universal relationship between the energy demands of organisms (from microorganisms to elephants) and their size predicts the reduction in the function of mitochondria. Smaller cells, which result from a large cell having divided, were suggested to have inherited their parent's low mitochondrial functionality. Cells were predicted to “reset” their mitochondrial activity as they initially grow and reach an “optimal” size.

We were interested in the mitopeak, and wondered if scientifically simpler hypotheses could account for it. Using mathematical modelling, our idea was to use the observation that as a cell becomes larger in volume, the size of its mitochondrial population (and hence power supply) increases in concert. We considered that a cell has power demands which also track its volume, as well as demands which are proportional to surface area and power demands which do not depend on cell size at all (such as the energetic cost of replicating the genome at cell division, since the size of a cell's genome does not depend on how big the cell is). Assuming that power supply = demand in a cell, then bigger cells may more easily satisfy e.g. the constant power demands. This is because the number of mitochondria increases with cell volume yet the constant demands remain the same regardless of cell size. In other words, if a cell has more mitochondria as it gets larger, then each mitochondrion has to work less hard to satisfy power demand.

To explain why the smallest cells also have mitochondria which do not appear to work hard, we suggested that some smaller cells could be in the process of dying. If smaller cells are more likely to die, and if dying cells have low mitochondrial functionality (both of these ideas are biologically supported), then, by combining this with the power supply/demand picture above, the observed mitopeak naturally emerges from our mathematical model.

As an alternative model, we also suggested that the mitopeak could come entirely from a nonlinear relationship between cell size and cell death, with mitochondrial functionality as a passive indicator of how healthy a cell is. This indicates the existence of multiple hypotheses which could explain this new dataset.


A recent study has provided new data for the relationship between cell physiology and mitochondrial functionality. We have used mathematical modelling to suggest that a mixture of cellular power demand scaling, as well as cell death, could intuitively account for these new data. However, a nonlinear relationship between cell death and cell size could also account for these data, as well as a nonlinear relationship between mitochondrial functionality and cell size, as proposed by the original authors of the dataset. By integrating such a relationship between cell size and mitochondrial functionality into one of our existing models, we found that this “mitopeak” helps explain a wider set of cell physiological data. Using our model to highlight these competing hypotheses, we suggest future experiments to gather further support for these potential explanations.

Interestingly, we also found that the mitopeak could be an alternative to one aspect of a model we used some time ago to explain a different dataset, looking at the physiological influence of mitochondrial variability. Then, we modelled the activity of mitochondria as a quantity that is inherited identically by each daughter cell from its parent, plus some noise -- noting that this was a guess at the true behaviour because we didn't have the data to make a firm statement. We needed this relationship because observed functionality varied comparatively little between sister cells but substantially across a population. The mitopeak induces this variability without needing random inheritance of functionality, and may thus be the refined picture we've been looking for. These ideas, and suggestions for future strategies to explore the link between mitochondria and cell physiology in more detail, are in our new BioEssays article here. Juvid, Nick, and Iain.

Wednesday, 27 January 2016

ARTICLE: The function of mitochondrial networks

What is the function of mitochondrial networks? A theoretical assessment of hypotheses and proposal for future research

  • Mitochondria in our cells sometimes form large networks and sometimes remain independent, with changes between these structure often linked to disease: we use physics and maths to explore why these networks may form and be valuable to the cell, and to suggest ways to find out more
Mitochondria are dynamic energy-producing organelles, and there can be hundreds or even thousands of them in one cell. Mitochondria (as we've blogged about before) do not exist independently of each other: sometimes they form giant fused networks across the cell, sometimes they are fragmented, and sometimes they take on intermediate shapes. Which state is preferred (fragmented, fused or in between) seems to depend on, for example, cell-division stage, age, nutrient availability and stress levels. But what is exactly the reason for the cell preferring one morphology over another?

Nonlinear phenomena -- like some percolation effects -- could help account for the functional advantage of mitochondrial networks

We recently wrote an open-access paper (free here in the journal BioEssays) in which we try to answer the question: what is it about fused mitochondrial networks that could make them preferable to fragmented mitochondria? Our paper differs from previous work in that we attempt to use a range of mathematical tools to gain insight into this complex biological system and we try to hit on the root physiological and physical roles. We use physical models, simulations, and numerical estimations to compare ideas, to reason about existing hypotheses, and to propose some new ones. Among the possibilities we consider are the effects of fusion on mitochondrial quality control, on the spread of important protein machinery throughout the cell, on the chemistry of important ions, and on the production and distribution of energy through the cell. The models we use are quite simple, but we propose ideas for improving them, and experiments that will lead to further progress.

Taking a mathematical perspective leads to a central idea: for fused mitochondria to be 'preferred' by the cell, there must be some nonlinear advantage to fusion. That's what the fuzzy line is representing in the figure above. A big mitochondrion formed by fusing two smaller ones must in some sense be 'better' than the sum of the two smaller ones, or there would be no reason why a fused state is preferred.

Mitochondria can fuse to form large continuous networks across the cell. From a mathematical and physical viewpoint, we evaluate existing and novel possible functions of mitochondrial fusion, and we suggest both experiments and modelling approaches to test hypotheses

What is the source of this nonlinearity? We find several physical and chemical possibilities. Large pieces of fused mitochondria are better at sharing their contents (e.g. proteins, enzymes, and possibly even DNA) than smaller pieces of fused mitochondria. If the 'fusedness' of the mitochondrial population increases by a factor of two, the efficiency with which they share their contents increases by more than two! Also, fusion can reduce damage. If a mitochondrion gets physically or chemically damaged, having some fused non-damaged neighbours can help to reduce the overall harm to the cell. Finally, fusion may increase energy production because of a nonlinear chemical dependence of energy production on mitochondrial membrane potential. Fusing more mitochondria may, under certain circumstances, have the effect of increasing energy production. Hanne, Iain and Nick [blog article also here]

ARTICLE: Turbocharging the back of the envelope

Explicit tracking of uncertainty increases the power of quantitative rule-of-thumb reasoning in cell biology

  • Estimated numbers in biology (and life) are often uncertain: we've made a calculator to work with this uncertainty and help make calculations more interpretable (with a particular focus on understanding how the cell works)
The numbers that we use to describe the world are rarely exact. How long will it take you to drive to work? Perhaps "between 20 and 30 minutes". It would be unwise (and unnecessary) to say "exactly 23.4 minutes".

This uncertainty means that "back-of-the-envelope" calculations are very valuable in estimating and reasoning about numerical problems, particularly in the sciences. The idea here is to perform a calculation using rough guesses of the quantities involved, to get an "order of magnitude" estimate of the answer you're after. Made famous in physics as "Fermi problems", attributed to Enrico Fermi (who used rough reasoning to deduce quantities from the power of an atomic bomb to the number of piano tuners in Chicago), this approach is integral in many current applications of maths and science. Cool books like "Street-fighting Mathematics", "Guesstimation", "Back of the envelope physics", the excellent "What If?" section of xkcd, and the lateral interview questions facing some job candidates: "how much of the world's water is contained in a cow?" are all examples.
 
Calculations in biology, such as the time it takes for a protein (foreground) to diffuse through an E. coli cell (background), are often subject to large uncertainties. Our approach and web tool allows us to track this uncertainty and obtain a probability distribution over possible answers (plotted).

We've built a free online calculator (Caladis -- calculate a distribution) that complements this approach by allowing one to take the uncertainty in one's estimates into account throughout a calculation. For example, what volume of CO2 is produced by our yearly driving? We could say that we cover 8000 miles per year "give or take" 1000 miles, and find that our car's CO2 emissions are between 100 and 150 grams per kilometre. Our calculator allows us to do the necessary conversions and sums while taking this possible variability into account -- doing maths with "probability distributions" describing our uncertainty. We no longer obtain a single (possibly inaccurate) answer, but a distribution telling us how likely any particular answer is -- in this case a rather concerning bell-shaped distribution between 1 and 2 tonnes which can be viewed here.

In the sciences, particularly in biology, measurements often have substantial uncertainties -- due to experimental error, natural variability in the system of interest, or both -- and so using distributions rather than single numbers in calculations allows us to understand and process more about the question of interest. "Back-of-the-envelope" calculations are certainly useful in biology but, owing to the uncertainties involved, one can trust one's estimates better if one has a smart envelope that takes that uncertainty into account.  We've written an accompanying paper (free here in Biophysical Journal) showing how to use our calculator -- in conjunction with the excellent Bionumbers online database, a collection of (often uncertain) experimental measurements in biology -- to make real biological calculations more powerful. Do have a go at using our calculator at www.caladis.org: it's user-friendly and there are lots of examples showing how it works! Iain and Nick [blog article also here]

ARTICLE: Polyominoes: mapping genotypes to phenotypes

A tractable genotype–phenotype map modelling the self-assembly of protein quaternary structure


  • Proteins in our cells have intricate structures built by genetic instructions, and these structures are vital for life: we produce a computational model to explore the relationship between genetic instructions and structure, and how evolution and mutation may change proteins.
Biological evolution sculpts the natural world and relies on the conversion of genetic information (stored as sequences, usually of DNA, called genotypes) into functional physical forms (called phenotypes). The complicated nature of this conversion, which is called a genotype-phenotype (or GP) map, makes the theoretical study of evolution very difficult. It is hard to say how a population of individuals may evolve without understanding the underlying GP map.

This is due to the two fundamental forces of evolution -- mutations and natural selection -- acting on different aspects of an organism. Mutations occur to genotypes (G), while natural selection, the ultimate adjudicator of the fate of mutations in the population, acts on the phenotype (P). Without understanding the link between these two -- the GP map -- we can't easily say, for example, how many mutations we expect important proteins within a virus strain to undergo with time, and thus how quickly the virus will evolve to be unrecognised by our immune systems.

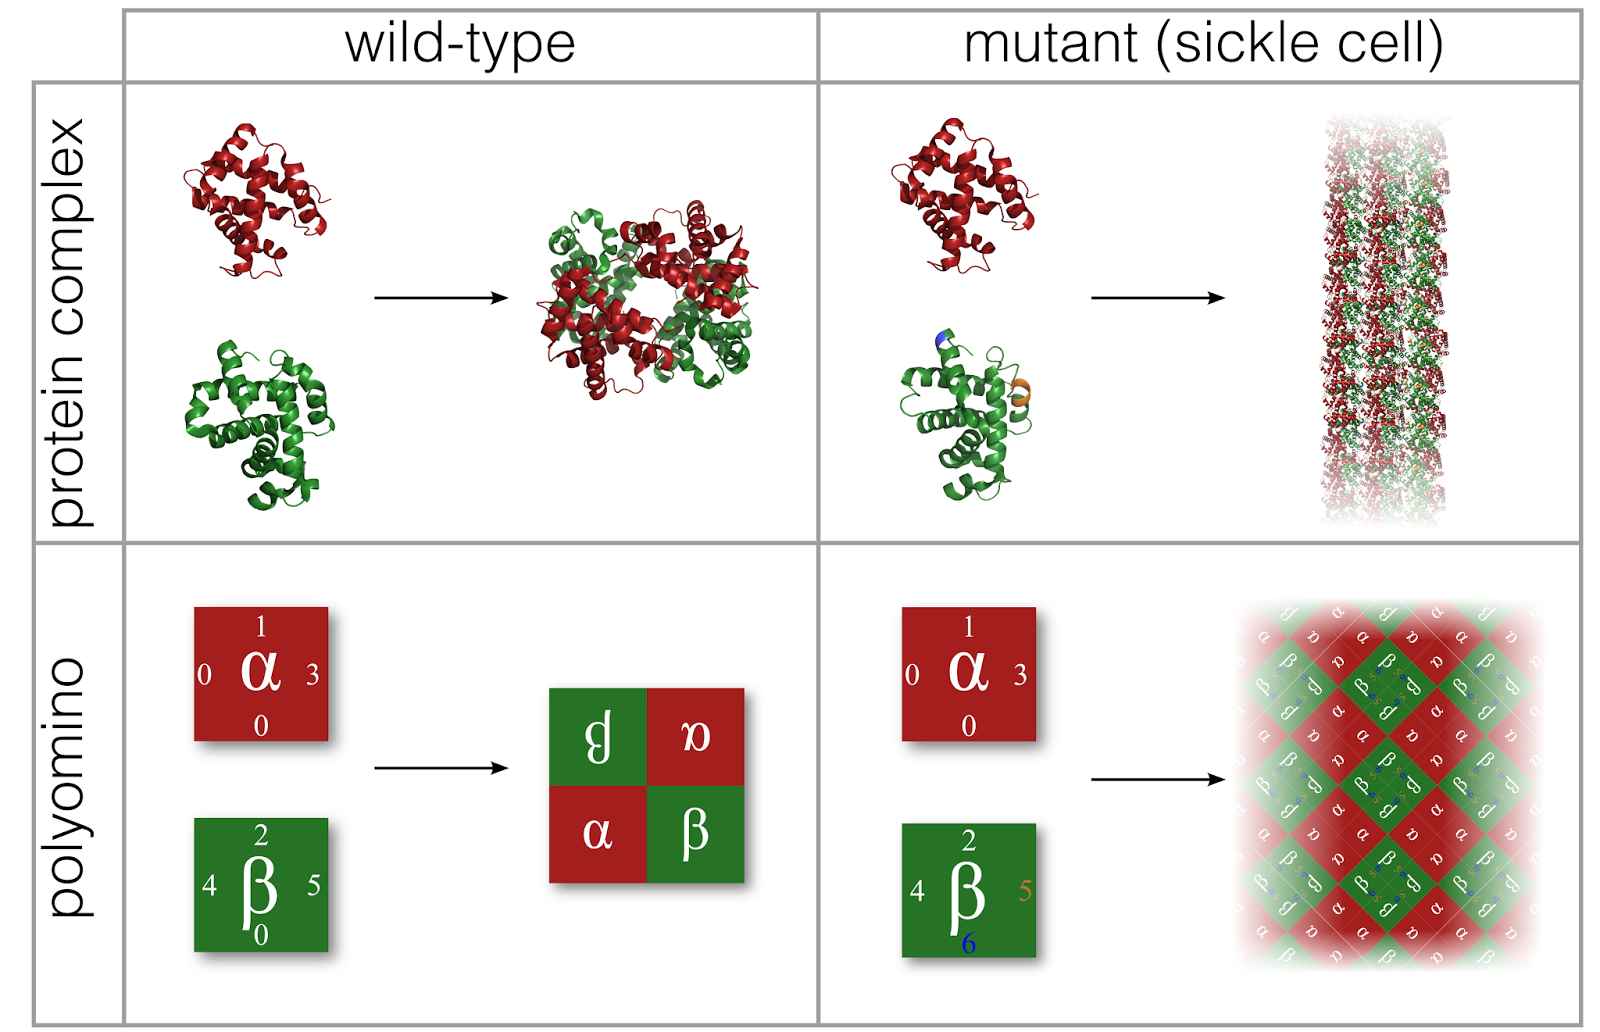
Simple models for the mapping of genotype to phenotype have helped answer important questions for some model biological systems, such as RNA molecules and a coarse-grained model of protein folding. One important class of biological structure which has not yet been modelled in this way are protein complexes: structures formed through proteins binding together, fulfilling vital biological functions in living organisms. In this work, we introduce the "polyomino" model, based on the self-assembly of interacting square tiles to form polyomino structures. The square tiles that make up a polyomino are assigned different "sticky patches", modelling the interactions between different proteins that form a complex. A huge range of structures can be formed by varying the details of these patches, mimicking the range of protein complexes that exist in biology (though there are some obvious differences in the shapes of structures that can be formed).

Our simple model explores the interactions between protein subunits, and how these interactions shape a surface that evolution explores. (top) Sickle-cell anemia involves a mutation that changes the way proteins interact, making normally independent units form a dangerous extended structure. (bottom) Our polyomino model models this effect. The resultant dramatic effects on structure, fitness, and evolution can then be explored.

Despite its abstraction we show that the polyomino model displays several important features which make it a potentially useful model for the GP map underlying protein complex evolution. On top of this, we demonstrate that our model possesses similar properties to RNA and protein folding models, interestingly suggesting that universal features may be present in biological GP maps and that the "landscapes" upon which evolution searches may thus have general properties in common. You can find the paper free here and you can play with polyominoes here! Iain [blog article also here]

ARTICLE: Taking the pulse of cellular power stations

Pulsing of Membrane Potential in Individual Mitochondria: A Stress-Induced Mechanism to Regulate Respiratory Bioenergetics in Arabidopsis


  • Mitochondria in plants sometimes switch off their membrane potential, which contributes to their ability to make energy for the cell: we characterise this "pulsing" and explore how it can be beneficial to plants under stress

We've just written an article in the journal Plant Cell about pulsing cellular power-stations and will motivate it by an analogy. Imagine we have a reservoir of water, and this water flows downhill through an outlet pipe, turning a turbine and producing energy. In this thought experiment, we're faced with a problem: the only way we can get water into our reservoir is by pumping it into the bottom of the reservoir. The higher up a reservoir is, the harder it is to pump water up there and the higher the risk of pumps overheating and getting damaged.

The problem can be solved by allowing the height of our reservoir to vary. If we lower our reservoir, it will become easier to fill, and the higher water pressure that arises from an increasingly filled reservoir will partly compensate for the fact that turbine-turning water will flow downhill from a lowered height, while allowing the pumps to relax and cool.

This model is a crude representation of mitochondria, the power stations of the cell, which use energy from respiration to create an energetic gradient across their membranes -- like a natural version of an AA battery. In our picture, this corresponds to the pumps feeding into our reservoir -- and in the cell, these pumps produce dangerous chemicals when they are overworked. The gradient they produce imbues protons with energy that is part electrical -- which we picture as the height of our reservoir -- and part chemical -- which we picture as the amount of water in our reservoir. These protons then flow through a protein complex -- the turbine -- to produce ATP, the universal cellular fuel.

An abstract representation (acrylic on canvas) of a single mitochondrion undergoing a 'pulse'. Its change in energy status is shown by the change in colour that we have also observed by microscopy using fluorescent sensors. Artist: Markus S

When mitochondria pump many protons, their "reservoirs" rise, with the increase in height forcing the pumps to work harder to pump water into the reservoir. This work produces dangerous chemicals which can damage the cell and the mitochondria themselves (called reactive oxygen species - they're what antioxidants try to combat). We have found a new mechanism by which this risk is decreased: if mitochondria are having to work hard, they "pulse", spontaneously lowering the height of their reservoir. This decreases the amount of work that the mitochondrial pumps have to do to fill the reservoir. The amount of turbine-turning energy per unit of water decreases, but as it becomes easier to fill the reservoir, more water gets pumped into it, partly compensating for the loss of height by an increase in volume. The pulsing process thus lowers the reservoir but fills it with more water, allowing the mitochondrial pumps to relax and reducing the production of dangerous chemicals.

We observed these pulses, spontaneous decreases of mitochondrial membrane potential, in Arabidopsis thaliana, a model plant species used in many biological contexts. Treating plant mitochondria with a variety of chemicals and observing the effects on pulsing, we deduced a biochemical mechanism by which pulsing occurs: a controlled influx of cations such as calcium ions into the mitochondrial matrix decreases membrane potential. We also found that pulsing is increased when plants face stressful environments: if they are suddenly heated, for example, or exposed to toxic chemicals. This novel mechanism may help explain some of the variability that our cellular engines exhibit and may be an important discovery in considering how mitochondria react to dangerous cellular conditions. You'll find the article here. Iain, Markus & Nick [blog article also here].

ARTICLE: Walking on evolutionary landscapes

Epistasis can lead to fragmented neutral spaces and contingency in evolution

  • Mutations can cause disease and diversity by changing structures in biology: we use a computational model to understand what changes are possible and how evolutionary future is constrained by the current state of organisms
Evolution can, in an abstract sense, be pictured as a journey through a genetic "space". A set of co-ordinates (like latitude and longitude, but more detailed) in this space corresponds to an organism's "genotype" -- the ordered set of As, Cs, Gs, and Ts found in its DNA. Each genotype encodes information about physical features of the organism -- its "phenotype". Mutations and other genetic changes cause steps from one point to another in genome space, and some of these steps will change the phenotype of an organism. As an artificially simple example, imagine a case where the genotypes AA and AC may give an organism red feet, but AG and AT give it blue feet. The offspring of a red-footed organism with genotype AA may pick up an A->C mutation in the second position (AA->AC) and keep their parent's red feet; or they may pick up an A->T mutation (AA->AT) and have a new blue-footed phenotype.

The structure of this evolutionary space -- the pattern of phenotypes encoded by connected genotypes -- clearly affects how mutations can change the form of organisms, and is thus central to our understanding of evolution. Mutational changes cause genetic diseases, allow bacteria and viruses to adapt to our immune response, and generate the beautiful biodiversity in the world around us. We aim to learn more about these systems, how they change with time, and their evolutionary limitations, by studying evolutionary spaces in a computer.

A schematic genome space. Each point on the grid is a genotype, which encodes a phenotype (red squares, blue circles, green diamonds, etc). Evolution can step between adjacent points through mutations -- a mutation may move an organism to its left neighbour, for example, or upwards by one point. Some mutations -- for example, a rightwards step from the top left corner -- keep the phenotype (green diamond) intact. Some (a downwards step from the top left corner) change the phenotype (green to blue). Not all genotypes encoding the same phenotype are connected, and different clusters have different evolutionary potential. For example, a gold triangle encoded by the cluster in the top right can only stay gold or become blue; a gold triangle encoded by the cluster on the left can stay gold or become blue, grey, or red.

We chose to look at the evolutionary space of RNA -- a class of biological molecule, examples of which play many vital roles in our cells. RNA, like DNA, consists of an ordered series of chemical groups denoted by letters, and RNA molecules fold into particular structures governed by this sequence of letters. These structures are central to the function of some RNAs, and the structure can be predicted by a computer program from the sequence of letters. So we have a model system where the phenotype (structure) corresponding to a genotype (letters) can easily be computed.

We explored the full genetic space of RNA molecules that consist of 15 letters (meaning that our computer had to fold over a billion structures!). In our survey in Proceedings of the Royal Society B here (free here) we found a large skew in the numbers of genotypes that encode a phenotype -- some structures are encoded by many different sets of letters and occupy a vast amount of the genetic space, and some are encoded only by very few genotypes. As mutations are random, we may expect to see these more frequent structures more commonly in the natural world (if all structures are affected equally by selective pressures). We also found that sets of genomes encoding the same phenotype are often disconnected in genome space. To pursue our simple example above, imagine AA and AC give red feet, AG and AT blue feet, TT and TG red feet and GT and GG green feet. The AA/AC red genomes aren't connected by single mutations to the TT/TG red genomes -- they form separate "clusters" in genospace. Furthermore, while a redfoot with genotype TT or TG can mutate to become either blue-footed (T->A in the first position) or green-footed (T->G in the first position), a redfoot with genotype AA or AC can only mutate to become blue-footed and cannot access the greenfoot genotypes without changing to something else first. One can see that this disconnected nature of genospace makes evolution contingent on genotype: redfoots with different genotypes can change in different ways. Understanding how this contingency appears in different systems will help us describe and even predict the outcomes of evolutionary processes. Iain

Tuesday, 26 January 2016

ARTICLE: Pretty polyominoes

Evolutionary dynamics in a simple model of self-assembly

  • The evolution of self-assembling structures in biology is hard to study: we build and explore a model that contains key features (a genome encoding interactions between physical subunits) and how evolution "learns" self-assembly rules
Lots of vital structures in biology must build themselves in the chaotic, frantic environment of our cells. Proteins -- machines in our cells that perform all sorts of tasks, from building cell scaffolding to assisting chemical reactions and moving electric charges -- are no exception. Many proteins self-assemble in cells, with different subunits coming together and sticking to each other to form a functioning product. The precision with which this assembly occurs "automatically" has been metaphorically described as a hurricane blowing through a pile of Lego and a fully-formed Lego train forming.

Proteins are complicated structures that have evolved over billions of years. To understand how evolution has "learned" the interactions between subunits that proteins need to successfully self-assemble, we need to work with a model system that includes the scientifically interesting details but is simple enough to investigate on paper or with a computer.

In a paper (here in Physical Review E; free here), we work with "polyominoes" as a model for evolving self-assembling systems. Polyominoes are shapes made up of connected square tiles (dominoes are polyominoes containing two tiles; the "tetromino" pieces in Tetris -- from which the game gets its name -- are polyominoes containing four tiles). In our model, these tiles have sticky edges, with some edges sticking to some others -- a list of numbers describes who sticks to whom. If we put tiles in a bag and shake them, some edges will stick, and a polyomino will form. We thus have the essential features of a random cell (the bag) and interactions between subunits (sticky edges) which are encoded by a genome (the list of numbers).


(left) The polyomino model. A "genome" (list of numbers) describes a set of square tiles with patchy edges. Some patches stick to each other -- in this case, 1 sticks to 2, 3 sticks to 4, and so on (0 sticks to nothing). Then, if the tiles are allowed to mix and meet, these sticky patches meet and form a larger structure. (right) The range of structures (axes) that can be built using two tile types, and the ways that evolution, acting on the model genomes, can change between output structures through single mutations (pink -- no link; darker -- more possible transitions).

We then simulated evolution in a computer, with random mutations changing the "genome" and natural selection acting on the resulting polyominoes. We show how different mutation rates, population sizes, and reproductive strategies affect the evolution of model biological structures. We also show that this evolutionary model can explain the symmetries of protein structures observed in biology. We explore the surprisingly rich set of structures that the model can produce, and the different modes of evolution that can lead from simple to complex forms -- helping us understand how important structures have evolved and may go wrong through mutation. There's more work on this here and an associated interactive simulation tool here! Iain

ARTICLE: Evolving social networks of genes

The effect of scale-free topology on the robustness and evolvability of genetic regulatory networks

  • How life both diversifies and maintains its function in the face of random mutation is an open question: we model the networks describing interactions between genes to explore this evolutionary tradeoff
A big question in evolutionary biology centres around an apparent paradox. To prevent mutations (which inevitably occur throughout life) from having damaging or fatal effects, organisms must be "robust" -- they must retain their biological functions even if some mutations occur. But to be able to adapt to changing environments and situations as generations pass, they must also be "evolvable" -- mutations must be able to change aspects of their biological functionality. How can we have a situation where mutations both have no functional effect and have the ability to change functionality?

To explore this question, we consider a class of key players in biological functionality: gene regulatory networks (GRNs), which describe how genes regulate each others' production in our cells. The products of one gene may lead to increased or decreased expression of another gene's products; this regulation is used by the cell to control its contents in response to signalling and sensory inputs.

In this paper, in the Journal of Theoretical Biology here (free here), we investigate the effects of mutations on the functions of model GRNs. Specifically, we calculate the different types of behaviour that a model GRN can show -- some of these involve a fixed state where every gene is either on or off, and some involve a cycling process where genes periodically switch on then off in a fixed pattern. We modelled mutations by randomly removing parts of the network, and explored how these mutations changed the GRN behaviour. If a random mutation changed the behaviour of the GRN (for example, changing the switching patterns of a gene), it is more evolvable; if the behaviour stays the same after a mutation, it is more robust.


(top) Several model GRNs: dots are genes, arrows describe one gene enhancing the production of another; flat ends describe one gene decreasing the production of another. (bottom) The gene states that each network can experience. Each point is a different on/off pattern of genes; the loops in the centre of the "flowers" are cycles of gene states that all connected states eventually collapse down to over time.

We found that the structure of a GRN dramatically affects the influence of mutations. We investigated so-called "Erdos-Renyi" (ER) structures, where nodes are connected randomly, and "scale-free" (SF) structures, where some "hub" nodes are connected to lots of others, but many more nodes connect only to very few neighbours. Social networks are often SF, with a small number of highly connected people and a large number of less connected one. SF networks were both more evolvable and more robust in the face of random mutations than ER ones: fewer mutations changed their behaviour, but those mutations that did have an effect gave rise to a more diverse set of new behaviours. We also found that SF networks were more robust to changes in environment (random changes to individual gene states). In biology we often observe that GRNs are scale-free: this work suggests the evolutionary advantages enjoyed by this class of networks, and thus a possible explanation for their appearance in biology. Iain


ARTICLE: From Chaitin to chitin

Self-assembly, modularity, and physical complexity

  • The amount of information required for evolved, or nanoengineered, structures to self-assemble is important in evolutionary biology and nanotechnology: we provide a consistent mathematical formalism to describe the physical complexity of structures motivated by self-assembly processes
Many structures in biology self-assemble -- that is, they are made up from individual subunits which stick to each other when mixed, so that the structure forms with no external "guiding hand". The process is like shaking a bag full of magnets and them sticking to each other -- though often a lot more subtle, with pairs of subunits interacting in specific ways and in specific arrangements.

Self-assembling is interesting both because it produces important machinery in biology -- like the proteins in our cells -- and because it could be an efficient way of producing structures in nanotechnology. If we can figure out a set of subunits and interactions that allows a desired product to self-assemble "automatically", we don't need to precisely manipulate tiny objects on the nanoscale to build nanotech.

But how difficult is it to design such a set of subunits and interactions? This question is important in both the biological and nanotech pictures -- nanotech because it represents the design effort required to produce a structure, and bio because how evolution has "learned" to produce complex structures through self-assembly is underexplored (though not, as intelligent design advocates would claim, an argument against evolution).
 
The process of describing a structure in terms of a self-assembling ruleset. 1. The structure (here a protein) is broken into its subunits. 2. The interactions between subunits are identified. 3+4. Subunits with different patterns of interactions are labelled different (red, blue, yellow); subunits with the same pattern of interactions are labelled the same (two yellows). 5. The subunit types and their interactions are recorded in a "genome".

In a paper in Physical Review E here (free here), we suggest a mathematical description of a structure that reports how much information is required for that structure to be self-assembled from interacting subunits. We give an algorithm to compute this for any structure, and link it to the concept of "algorithmic complexity" from computer science. In so doing, we link the process of self-assembling a structure to the progress of an algorithm producing a given output. This picture accounts for symmetry and modularity in structures, which reduce complexity because they involve existing information being repeated (for example, the same pattern appearing on different sides of a shape). This complexity measure describes the amount of information required to build a given self-assembling structure -- but can also be used more generally, to describe the complexity of structures in a self-consistent way. We use it to explore patterns of complexity in protein structures, highlighting the highly symmetric and modular structures often found in biology (an efficient way of minimising the required genetic information for a structure). Iain

Monday, 25 January 2016

ARTICLE: Computer viruses of the biological kind

Modelling the self-assembly of virus capsids

  • Viruses self-assemble protective protein coats that are important for their survival and proliferation: we use computer simulation to explore how this self-assembly takes place in the noisy environment of the cell, learning both about central viral processes and more general self-assembly principles
Virus capsids are protein coats that surround and protect the genetic information of a virus. Viruses have a range of different structures: many common ones are icosahedral, with structures like those of (UK) footballs, or the Eden Project. In this paper in Journal of Physics: Condensed Matter here (and on the cover! and free here), we use physics and computer simulation to investigate how virus capsids form in unfortunate host cells. 

The capsids we consider self-assemble -- that is, they form from interacting subunits with no external guidance. These subunits are made of proteins, parts of which chemically stick to each other. The shape of these subunits, and the geometry of the sticky patches, is vital in determining the final capsid structure.

We used a model for capsid assembly that had been explored previously in an "energy landscape" picture -- considering a huge range of possible arrangements of subunits, and identifying which structures were the most energetically favourable. Ideally, a perfect capsid -- with the subunits arranged in an icosahedron -- should be at the bottom of an energetic "valley" -- all other arrangements should naturally "fall" towards that structure. If the landscape is too flat, the subunits may never fall far enough into the valley to form the icosahedron; if it's too rugged, they may fall into another hole (corresponding to a malformed capsid structure) and get stuck. A related important factor is temperature: if the temperature is too high, proteins will whizz around and never manage to stick; if too low, they may stick and "freeze" in the wrong arrangements.


A snapshot of a simulation where viruses are assembling from proteins (red and green) in the presence of cellular crowding agents (yellow). Some have formed completely; other proteins have not yet met partners with which to bond.

Using computer simulations, we explored how model protein shape, density, and temperature affected capsids' ability to assemble correctly. We demonstrated the "sweet spots" for proteins of different shapes (too cold/sticky gives malformed structures, too hot/unsticky cannot form bonds). We showed that the presence of other stuff in the cell (cells are very crowded) interferes with assembly in idealised circumstances, but can enhance assembly by forcing proteins closer together when protein density is low (there's a video of self-assembly simulations here). We saw that viruses can assemble through rather complex dynamics, involving folding and reorganisation of half-formed structures. As well as complementing the "energy landscape" picture of self-assembly, these insights may help us design ways of interfering with capsid assembly and thus making things harder for viruses. Iain

Sunday, 24 January 2016

ARTICLE: DNA in computers

The self-assembly of DNA Holliday junctions studied with a minimal model

  • Physically rich DNA structures are vital in biology and genetics, and valuable in nanotechnology: we show that they can be studied with coarse-grained computer models, which are simple enough to simulate but rich enough to match real-world behaviour
DNA is a fascinating and flexible model. In our cells, it forms a famous "double helix" structure, but lots of other structures too, including "Holliday junctions", four-armed crosses that occur when DNA molecules meet and exchange genetic information. DNA is also used in nanotechnology, where our ability to design DNA molecules which interact in designed ways is harnessed to produce tiny molecular structures and machines. Holliday junctions also play important roles in this DNA nanotechnology, forming the corners of rigid structures.

To understand the physics of how DNA behaves in both these biological and nanotechnological contexts, we explored whether a simple model of DNA simulated in a computer can describe and predict its behaviour in the real world. DNA is made of many atoms and interacts in a complicated way with its environment: we aimed to reduced these complications as far as possible while retaining the necessary information to describe the physics of interest.

In a paper in the Journal of Chemical Physics here (free here), we build a model of DNA using common pieces of "kit" from a physicists' toolbox: model sticky particles linked in a chain, with interactions limiting how much the chain can be bent and twisted. The model is simple enough to simulate easily on a computer, but correctly forms duplexes and Holliday junctions analagous to those we see in the real world. It's a demonstration that so-called "coarse-grained" models (as opposed to modelling in fine detail) can be of use in simplifying and understanding complicated structures and physical systems.

Model DNA molecules forming four-armed Holliday junctions in a computer simulation.

This philosophy has since been developed and expanded hugely, leading to the highly influential oxDNA project, which has been used to explore how DNA nanomachines move and function and has led to a wide range of insights in chemical physics and nanotechnology. Iain